


About Brian DeChesare
Brian DeChesare is the Founder of Mergers & Inquisitions and Breaking Into Wall Street. In his spare time, he enjoys lifting weights, running, traveling, obsessively watching TV shows, and defeating Sauron.
The EBITDA Bridge visually shows how a company moves from core, recurring business cash flow in one period to the same number in the next period; it can also show differences between Net Income and EBITDA, EBITDA and Free Cash Flow, or Budgeted vs. Actual EBITDA.
EBITDA Brifge Tutorial
EBITDA Bridge Definition: The EBITDA Bridge visually shows how a company moves from core, recurring business cash flow in one period to the same number in the next period; it can also show differences between Net Income and EBITDA, EBITDA and Free Cash Flow, or Budgeted vs. Actual EBITDA.
We defined EBITDA in a previous tutorial, but to review, it stands for Earnings Before Interest, Taxes, Depreciation, and Amortization and is a proxy for a company’s core, recurring business cash flow from operations before the impact of capital structure, taxes, and re-investment.
It’s a way to evaluate a company’s core business without “distractions” from other sources, such as financing changes and tax differences.
However, it’s not always clear what drives EBITDA from one period to the next, or why it differs from metrics such as Net Income or Free Cash Flow.
In these situations, the “EBITDA Bridge” lets you understand the changes and differences visually, so you don’t have to squint at long numerical series:
That said, the standard EBITDA Bridge showing the changes from one year to the next is not always useful because:
A standard EBITDA bridge, taken from a modified version of an LBO model for NichiiGakkan (a Japanese nursing-home provider) in our courses, shows the change in EBITDA based on sources such as Pricing and Volume Growth and Expense Increases:
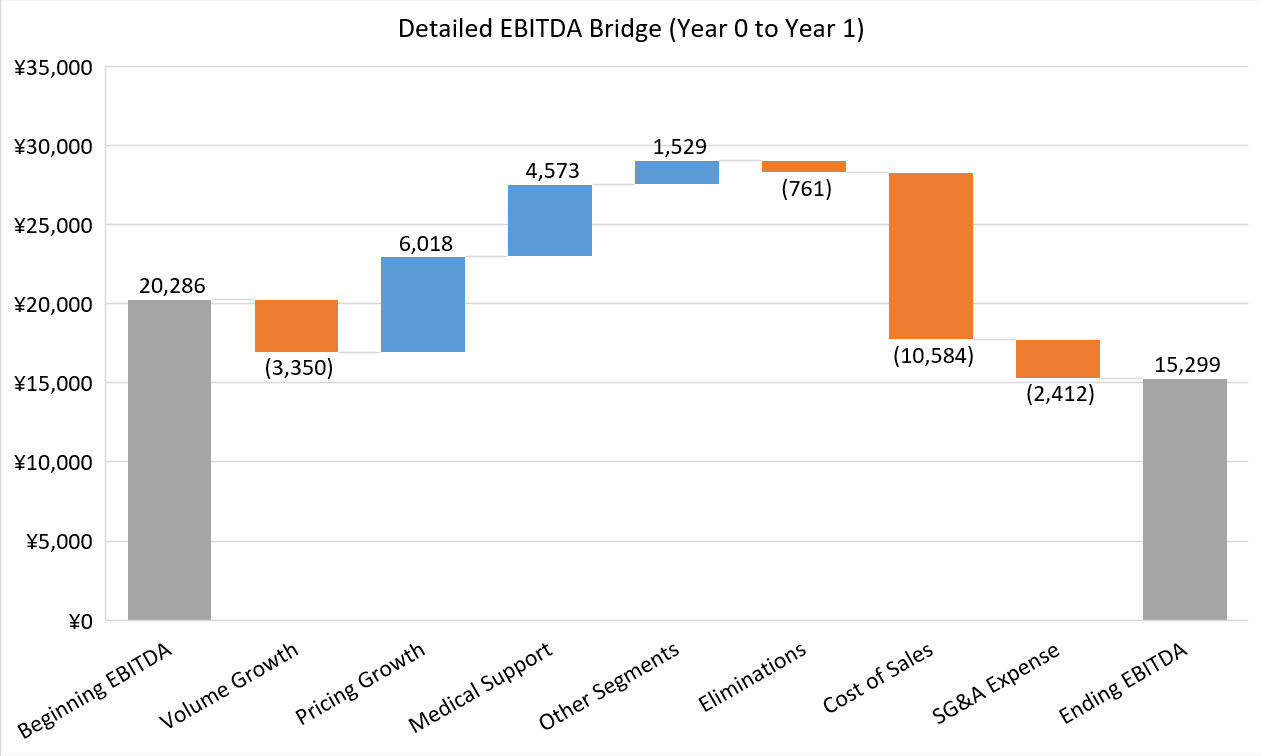
This is a stable, boring company in an established industry, and it’s not executing any unusual strategies, so the bridge is not that interesting.
The main insight is that the first year’s performance seems shaky because patient volume is falling, which is why EBITDA is lower by the end of the year.
Bain Capital acquired the firm not because it’s “exciting” or “AI forward,” but because it was underpriced at the time of the deal (despite these risk factors, such as the falling patient volume).
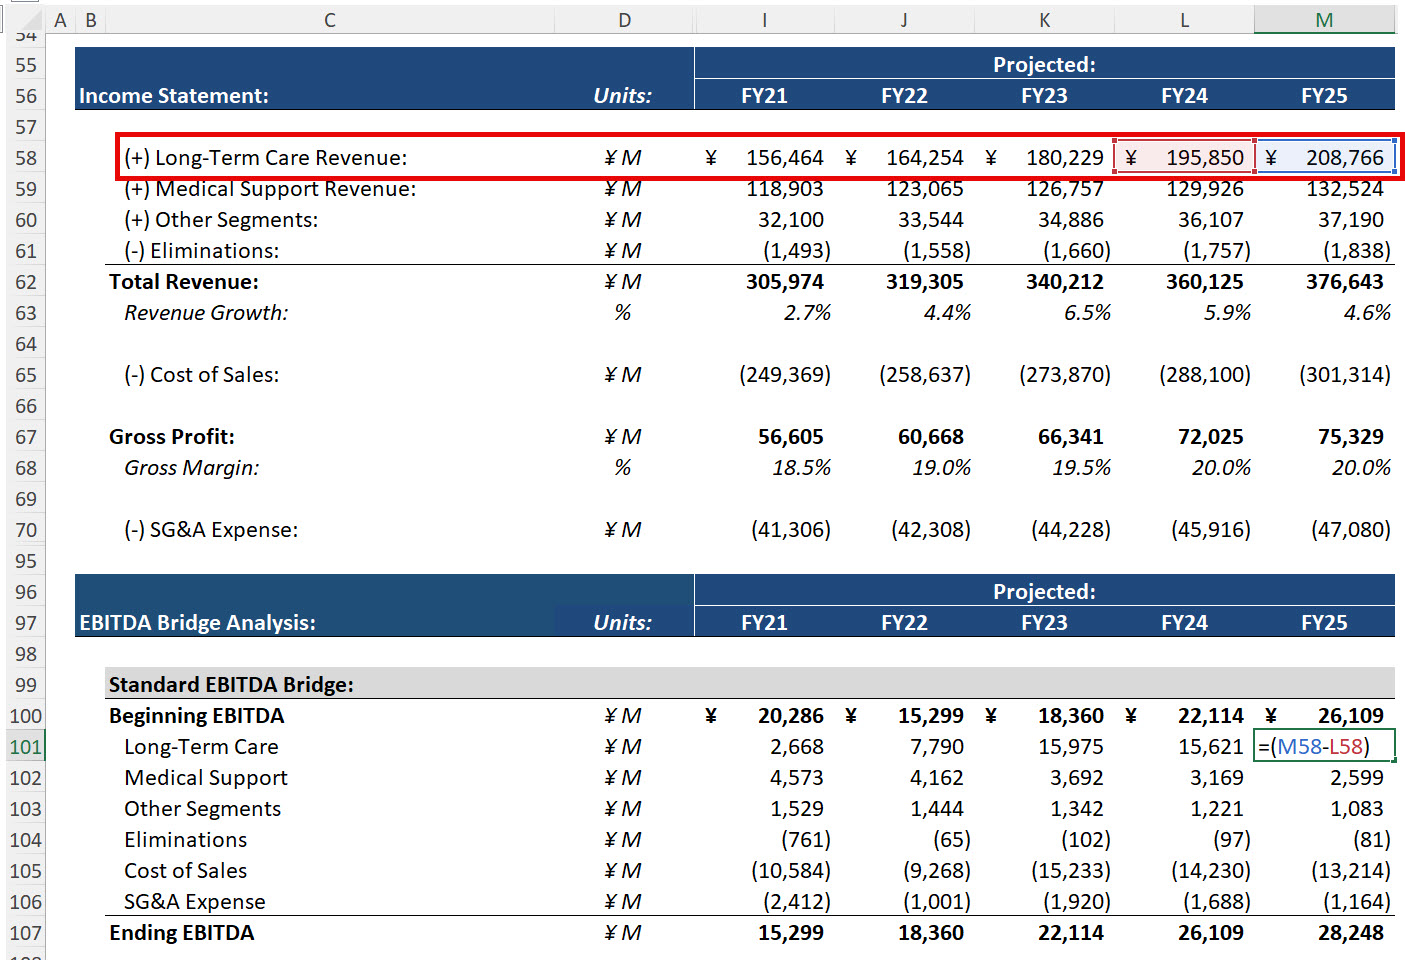
The simplest way to make an EBITDA bridge is to take all the components and calculate their differences from Year 1 to Year 2, as shown below:
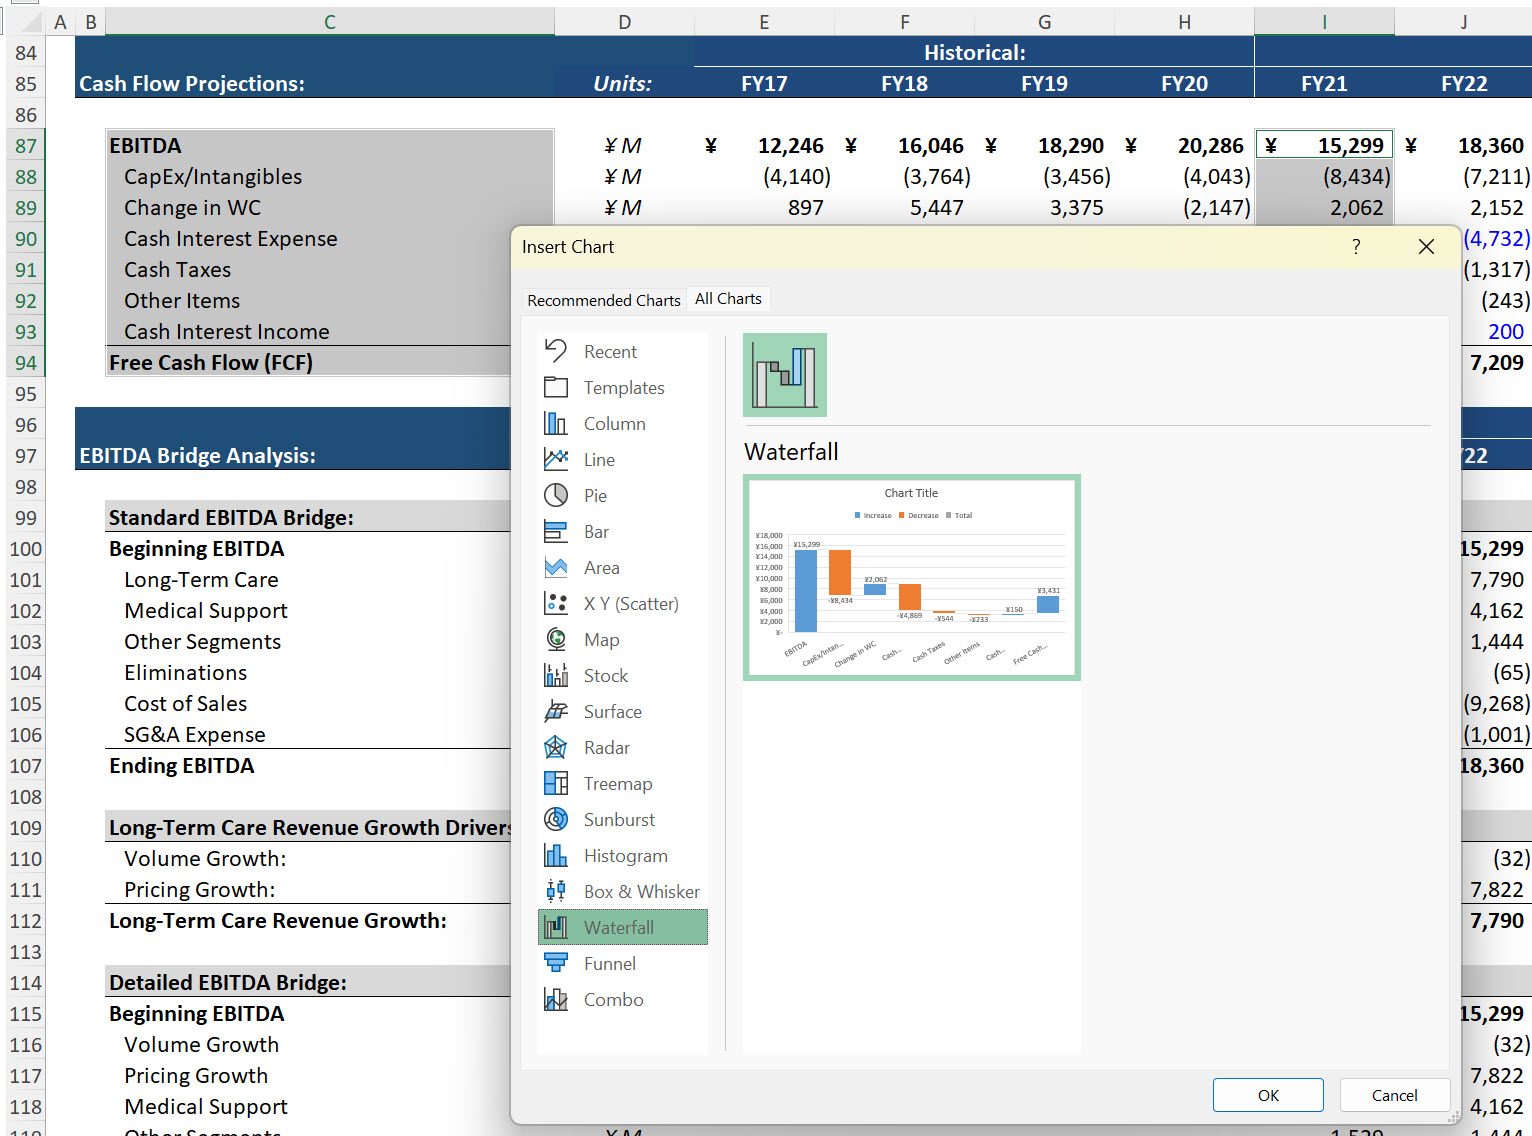
In any modern version of Excel, you can use the “Waterfall Chart” feature to turn this data into a waterfall chart with connectors:
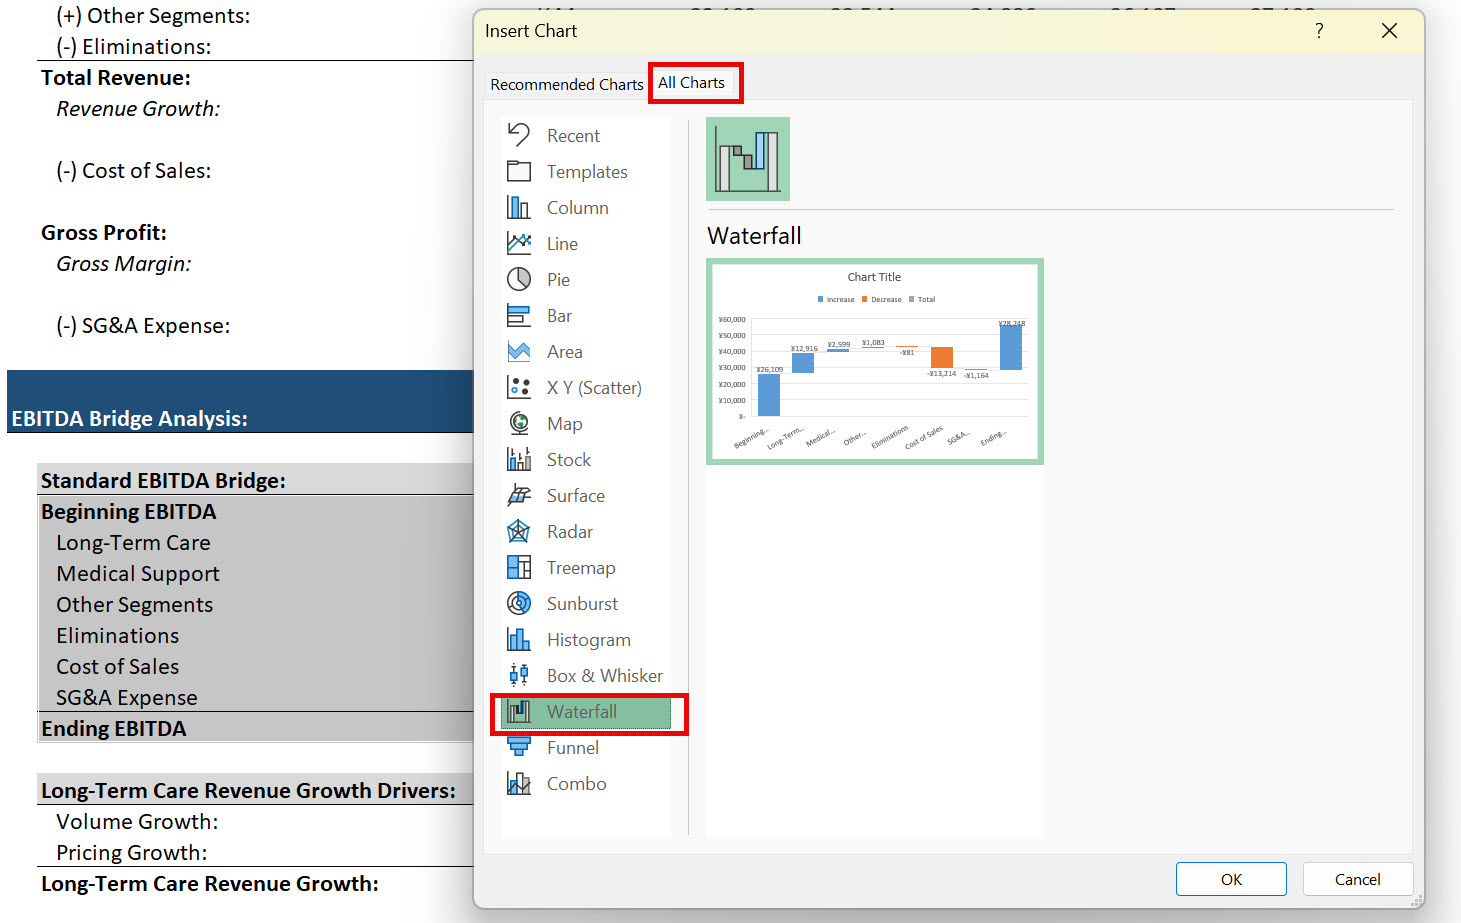
You can then apply formatting and set the correct bars to the “Totals” to represent the Beginning and Ending EBITDA.
If you want to do something more interesting, such as showing the split between Volume and Pricing Growth for the Change in Revenue, it takes more effort.
Going back to this NichiiGakkan example, the “Volume Growth” component equals:
=(New Patient Count – Old Patient Count) * Old Price per Patient
You’re saying, “Suppose that prices remained the same from last year to this year, and only the patient count changed. How would that affect revenue?”
And the “Pricing Growth” component equals:
=(New Price per Patient – Old Price per Patient) * New Patient Count
You’re saying, “Suppose that *only the prices* changed, but these changes apply to *this year’s* patient volume. How would revenue change?”
This makes the analysis more useful, but it also has limits because not all companies disclose enough information to do this.
This setup lets you create the more detailed EBITDA Bridge shown previously:
The main takeaway is that Year 1 performance is shaky because expenses are rising and patient volume is falling.
This makes sense because Japan has a declining population (but perhaps an increasing population of senior citizens?), but it is a major risk factor in the deal.
As you’ll see, the PE firm here (Bain) assumes a possible turnaround by the end, which another version of the EBITDA Bridge chart reveals.
In the EBITDA tutorial, we presented a few examples of “bridges” to move from EBITDA to Cash Flow from Operations for Best Buy and Target.
These are useful because cash flow, not EBITDA, drives long-term company value.
A company can record impressive EBITDA margins and growth rates, but if its cash flows are horrible because it’s spending a fortune on Capital Expenditures or Interest, it could still go bankrupt.
This is why you always look at metrics such as Free Cash Flow and Unlevered Free Cash Flow in addition to EBITDA.
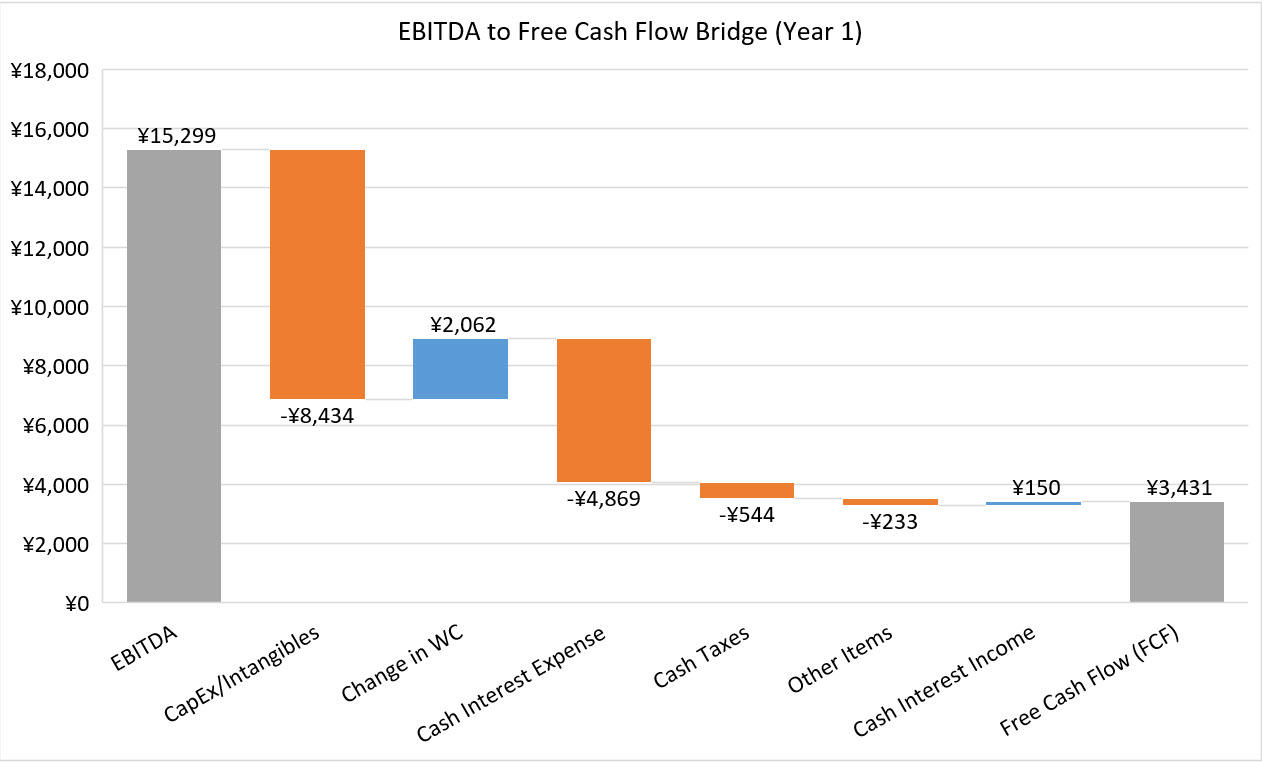
If you have all the components in Excel, this type of bridge is straightforward to set up using the built-in Waterfall Chart:
The takeaway is that this company’s Free Cash Flow differs from its EBITDA mostly because of its high CapEx, which is elevated in the first few projected years over its historical levels:
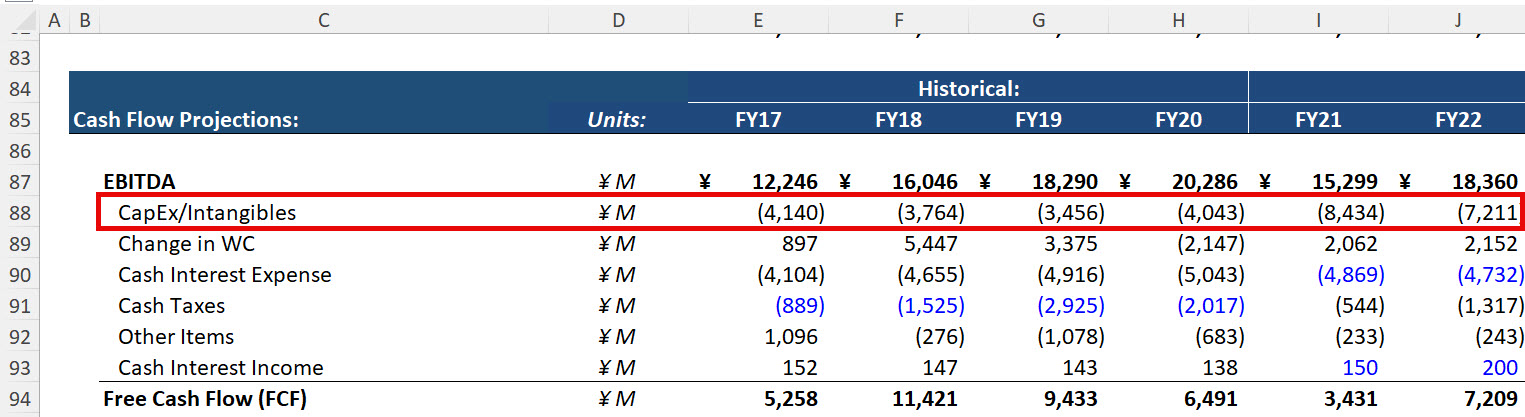
Management seems to be placing a huge bet on CapEx to upgrade nursing home facilities and justify higher patient prices.
This may or may not work – we’d need more knowledge of Japanese healthcare to say for sure – but we have a visual representation of this bet now.
Another reasonable use case is to review the finance team’s “budgeted” or “planned” EBITDA for a period and compare it to the actual numbers after the period ends.
For example, you could use it to do something like the following:
-Next year’s planned EBITDA is $110, based on a current EBITDA of $100, Pricing Growth of $4, Volume Growth of $3, and Cost Cuts of $3.
-The actual EBITDA is only $106 because Pricing Growth contributed $1 rather than $4, Volume Growth contributed $5 rather than $3, and Cost Cuts added $0 because the company could not cut anything.
-So, Pricing Growth was –3, Volume Growth was +2, and Cost Cuts were –3 relative to expectations.
The EBITDA bridge might look like this:
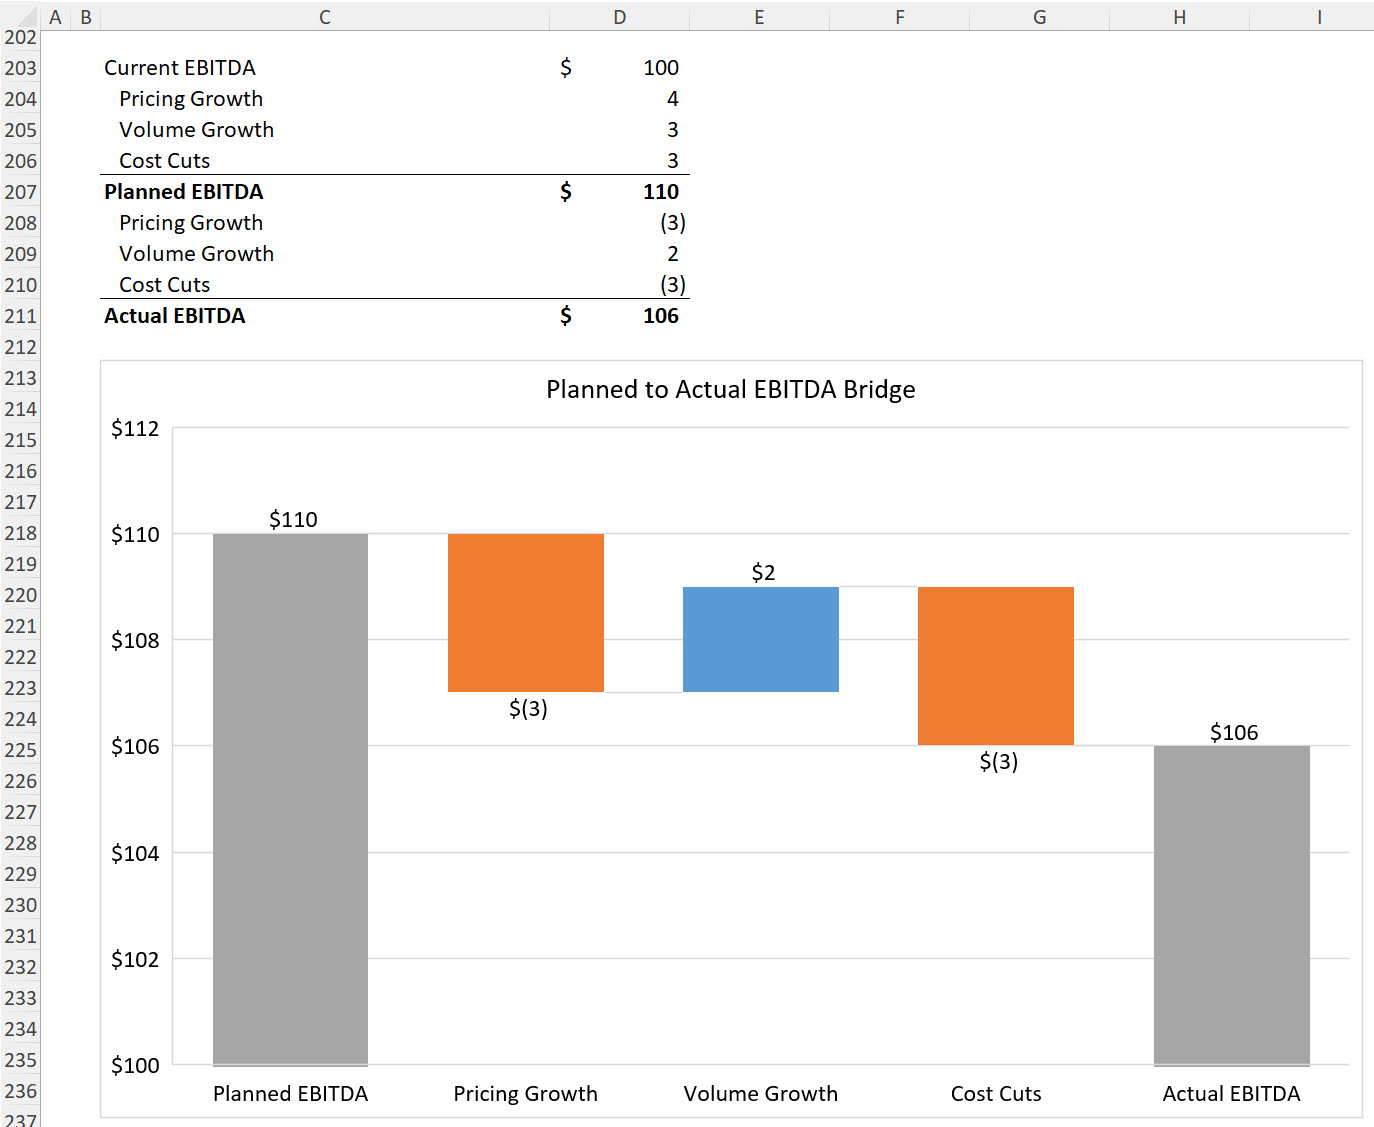
The takeaways are that this company lost some pricing power, and it couldn’t cut costs by reducing staff, negotiating better supplier agreements, or reducing office space.
At the top of this article, we listed some issues with the EBITDA bridge: It’s not especially insightful for most normal scenarios, companies don’t always disclose enough data to use it, and long-term trends matter more than short-term changes.
As an example, here’s NichiiGakkan’s EBITDA Bridge from “Year 0” (just before the deal) to “Year 1” (the first year after the deal), followed by its bridge from Year 4 to Year 5 of the projected period:
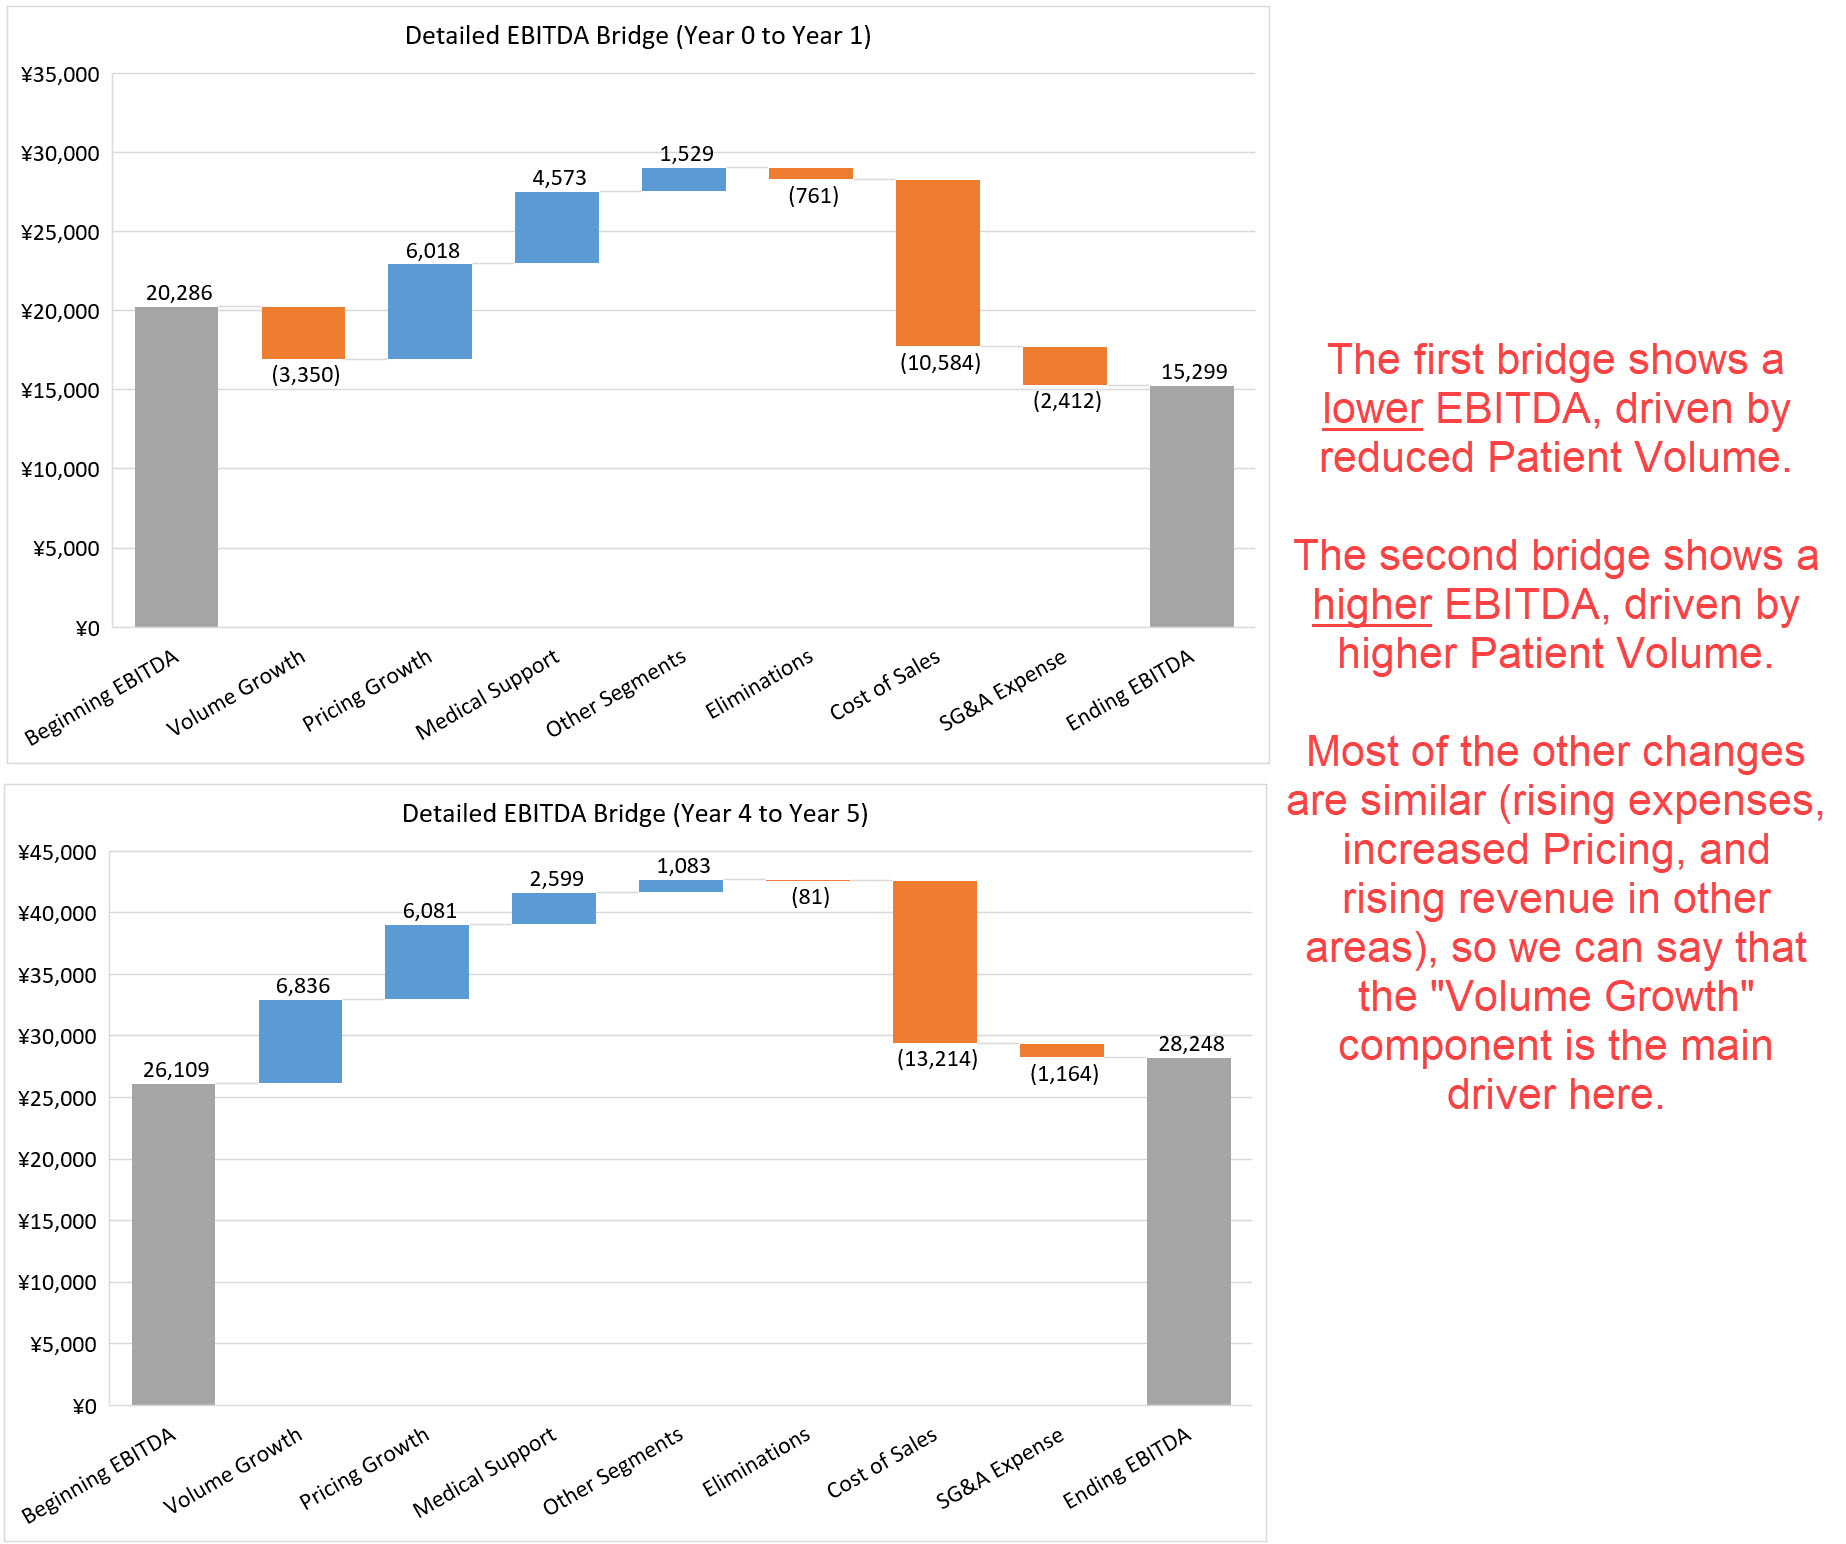
If you looked at these bridges in isolation, you’d walk away with completely different impressions.
Specifically, they tell different stories about the change in Patient Volumes and how that might affect EBITDA: The first graph shows declines, and the later one, further into the projected period, shows increases.
Which one is correct?
We don’t know, but we do know the PE firm (Bain Capital) assumed quite a turnaround story if it based the deal on these forecasts.
That might be plausible, or it might be nonsensical; we’d need to understand the market and longer-term trends to say for sure.

Brian DeChesare is the Founder of Mergers & Inquisitions and Breaking Into Wall Street. In his spare time, he enjoys lifting weights, running, traveling, obsessively watching TV shows, and defeating Sauron.

