Tables in PowerPoint: Full Video Tutorial, Samples, and Practice Exercise
In this tutorial, you’ll learn how to insert tables in PowerPoint, format them, change key settings, and use them to create useful slide layouts.
Tables in PowerPoint: Full Video Tutorial, Samples, and Practice Exercise
Tables in PowerPoint are useful for displaying text more visually without creating annoying alignment and distribution issues.
PowerPoint handles all the alignment and distribution for you because it ensures that each cell in a table lines up perfectly with the other cells in the same row and column.
Video Table of Contents:
0:51: Why Tables?
6:02: Inserting and Formatting Tables
13:20: Exercise: “Management Assumptions” Slide
20:47: Recap and Summary
[Click the “Files & Resources” tab to get all the PowerPoint files for this lesson.]

-
Become a presentation machine
Master the key shortcuts and commands for “warp speed” slide creation
-
Acquire the skills with dozens of practice exercises
Learn by doing – and check your work against the solutions
-
Save hours with our full macro package (25+ macros)
Automate formatting, tables, alignment, drawing guides, and more
Tables in PowerPoint are most common in investment banking and finance-related presentations when:
1) You are laying out the assumptions for a valuation, forecast, or other financial analysis, and you want something more interesting than bullets or paragraphs of text.
2) You want to summarize deal or investment terms with a bit of visual flair to avoid the “long boring blobs of text” syndrome.
3) You are creating “timelines” for product launches, deal processes, or other future events, and you want to display calendars or use a mix of shapes and tables to create better visuals.
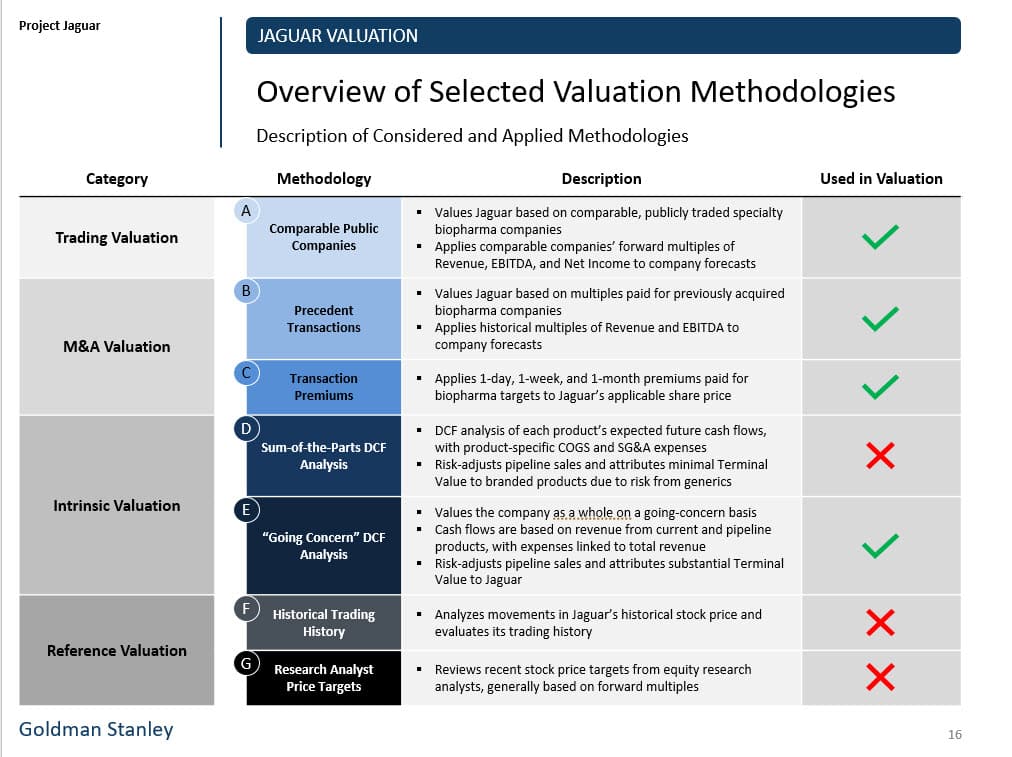
Here’s a quick example of a table in PowerPoint based on real bank presentations and our own materials:
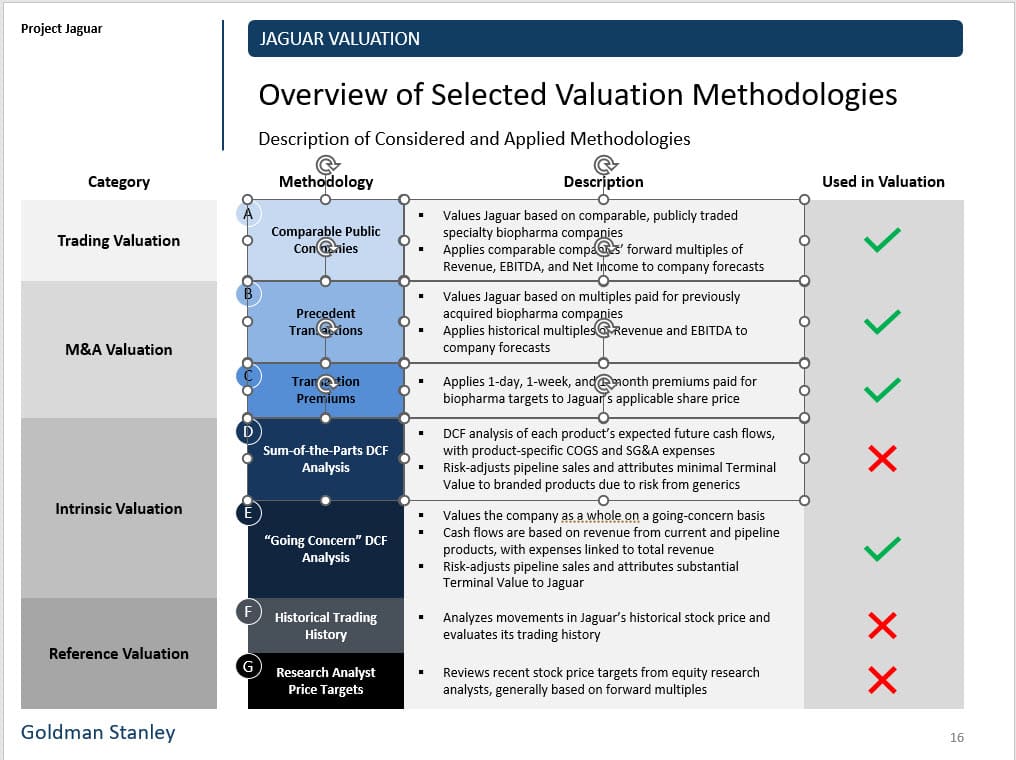
To understand the value of tables in PowerPoint, think about the image above, but imagine it as a collection of shapes instead:
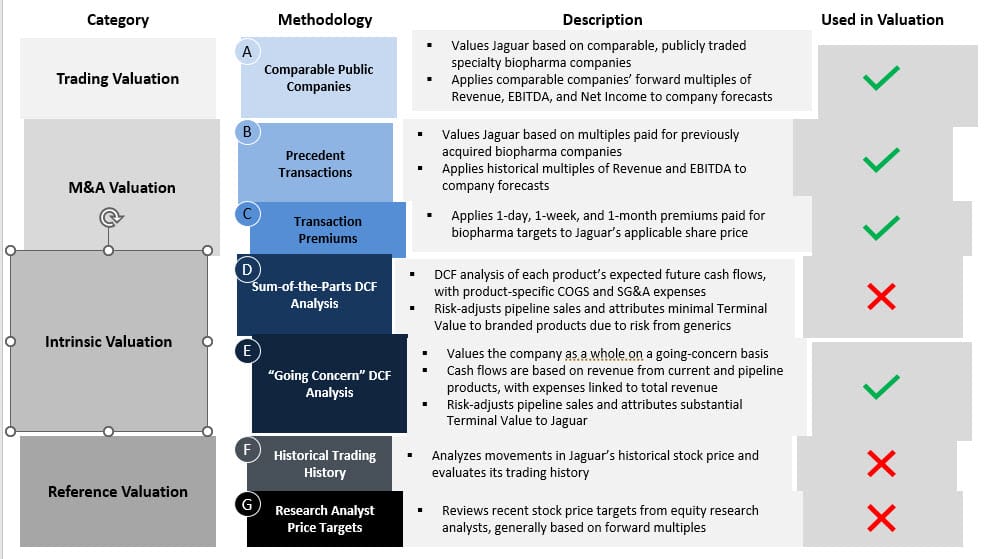
Let’s say that you edit it and accidentally change the positions of these shapes, which creates many alignment issues:
With a shape-based layout like this, you need to manually fix and tweak everything because there’s no quick, simple way to make all the shapes line up perfectly.
Various PowerPoint macro packages – including our own – can save time and fix some of these problems, but nothing’s perfect.
By contrast, if you had set up this slide as a table, you wouldn’t have had any issues with the edits because tables are automatically aligned properly.
And if the rows and columns in the table are not evenly distributed, you can fix that with a single click in the “Layout” tab after selecting the table:
That said, there are some downsides to tables in PowerPoint.
First, they may contain only text, so there’s no way to “insert” an image or Excel object and make it follow the table everywhere.
Second, copying text to and from tables can be cumbersome because you may have to go cell-by-cell, depending on your source and destination content.
Third, it’s difficult to align tables to other objects in PowerPoint, so it can be tricky to create complex layouts using images and shapes.
Finally, formatting tables can be annoying – unless you’re using macros in PowerPoint – because you cannot copy and paste formatting from an entire table to another entire table.
Tables in PowerPoint: Key Shortcuts for Inserting and Formatting Them
The “Insert Table” command is within the “Insert” (Alt, N) tab in PowerPoint:
The “Table Design” tab appears once you have selected a table or inserted a new table, and it lets you change various formatting elements of the table:
The “Layout” tab, which also appears once you have selected a table, has the commands for adding and deleting rows and columns, splitting and merging cells, and distributing rows and columns:
Key Shortcuts for Inserting Tables in PowerPoint (PC/Windows):
Alt, N, T: Insert Table (no Mac Equivalent)
Alt, JT: Table Design Tab (no Mac Equivalent)
Alt, JL: Table Layout Tab (no Mac Equivalent)
Tab: Move to Next Cell / Insert Row at End of Table (also works on Mac)
Shift + Tab: Move to Previous Cell (also works on Mac)
MAC NOTE: If you’re on the Mac, we recommend using a tool like Accelerator Keys to replicate these Alt-key shortcuts or a program such as Parallels to run the PC/Windows version of PowerPoint.
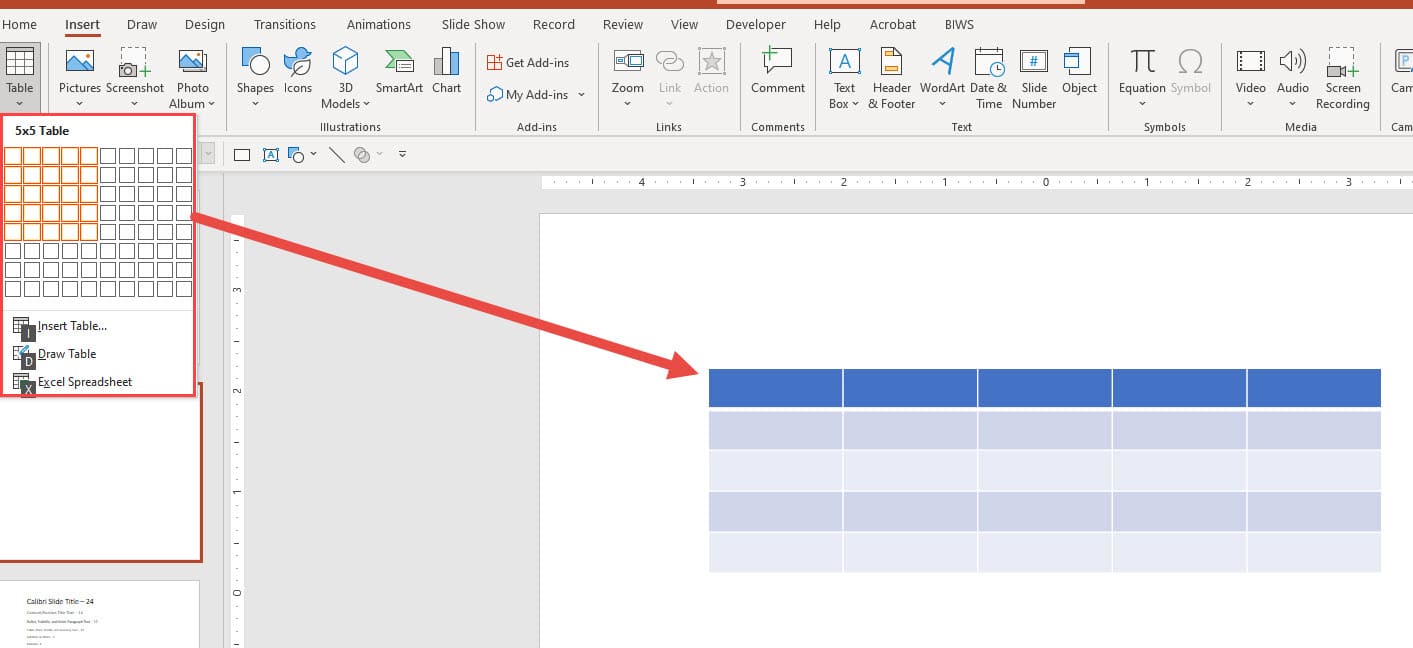
If you open a new PowerPoint file and insert a table with Alt, N, T, you can select the number of rows and columns:
Once you’ve inserted the table and picked the size you want, you can enter text in the individual cells:
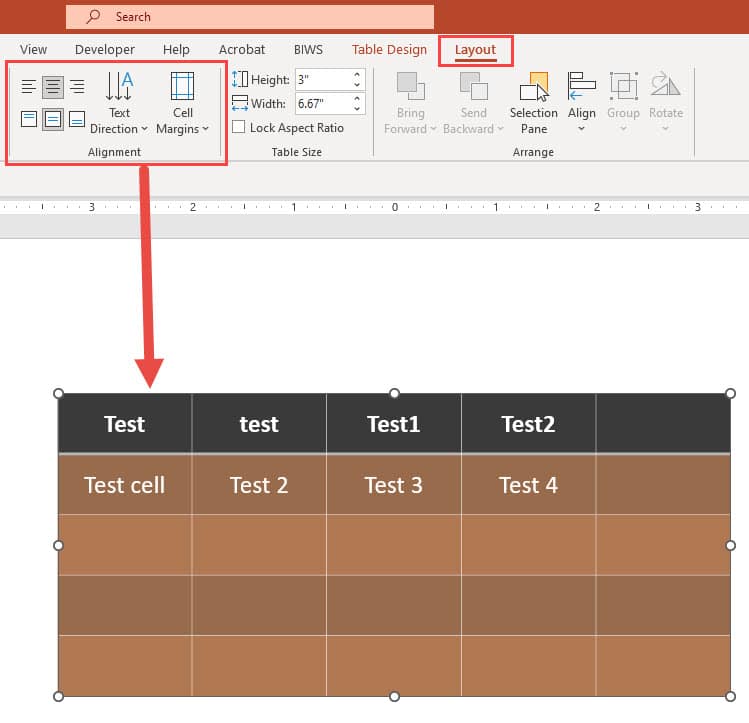
You can then use the “Design” and “Layout” tabs to change anything from the color scheme to the horizontal/vertical alignment, text direction, and margins in individual cells:
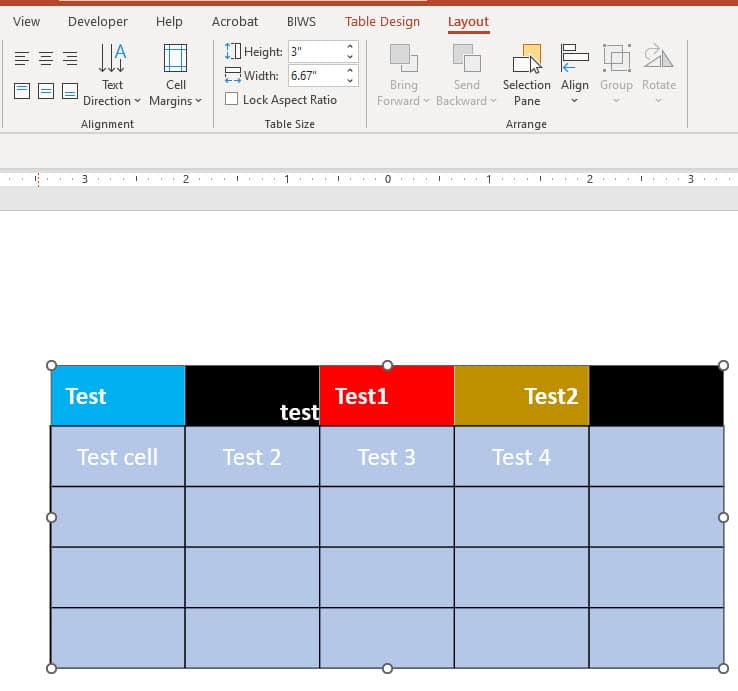
You can apply most of these changes to each cell individually or the entire table, depending on what you’ve selected:
In most cases, you do not want to format cells individually because it makes tables look very inconsistent.
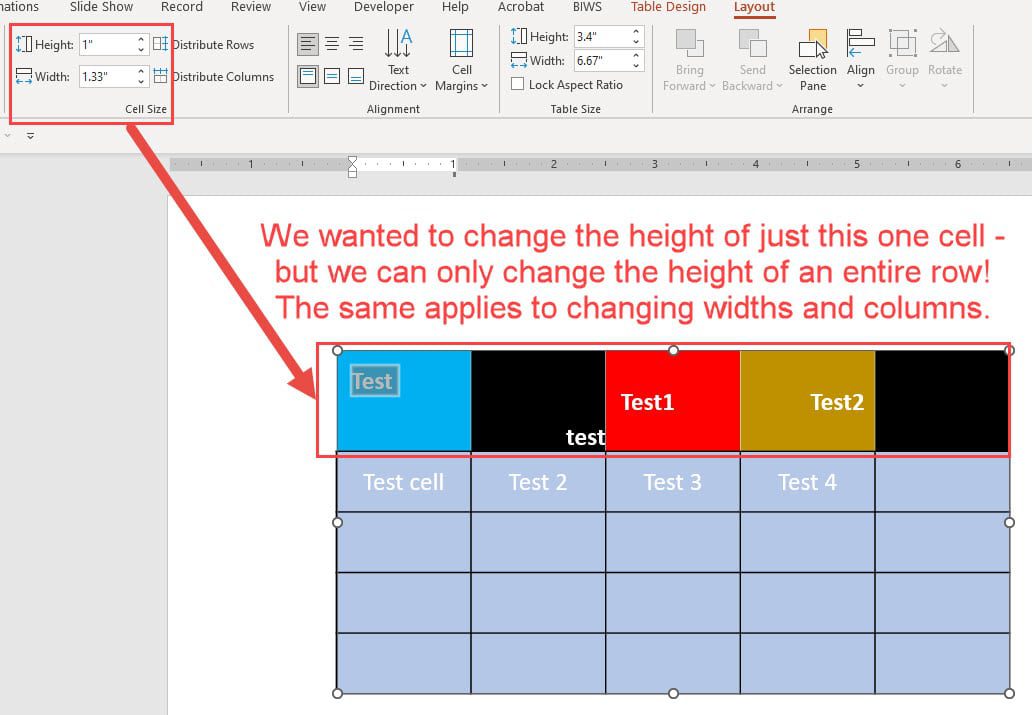
One exception to this ability to change individual cell properties is that if you change the “cell size” within the “Layout” menu, every cell in the same row or column also changes.
In other words, it’s impossible to change the height and width of just one individual cell – the only options are:
1) Change the height of an entire row or multiple rows in the table.
2) Change the width of an entire column or multiple columns in the table.
You can see an example of what happens here when we try to change the height of just one cell:
Tables in PowerPoint are collections of shapes that are automatically aligned and distributed into perfect rows and columns.
This is why they work well for “regular” layouts in grid structures but not so well for corporate hierarchy charts, maps, and anything else with irregular spacing.
Navigating Tables in PowerPoint
Typically, the fastest way to navigate cells is to use the mouse and click the cell you want to edit or click and drag to select the row(s) or column(s) you want.
However, the Tab shortcut (for both PC and Mac) will advance you to the next cell, and the Shift + Tab shortcut will take you to the previous cell.
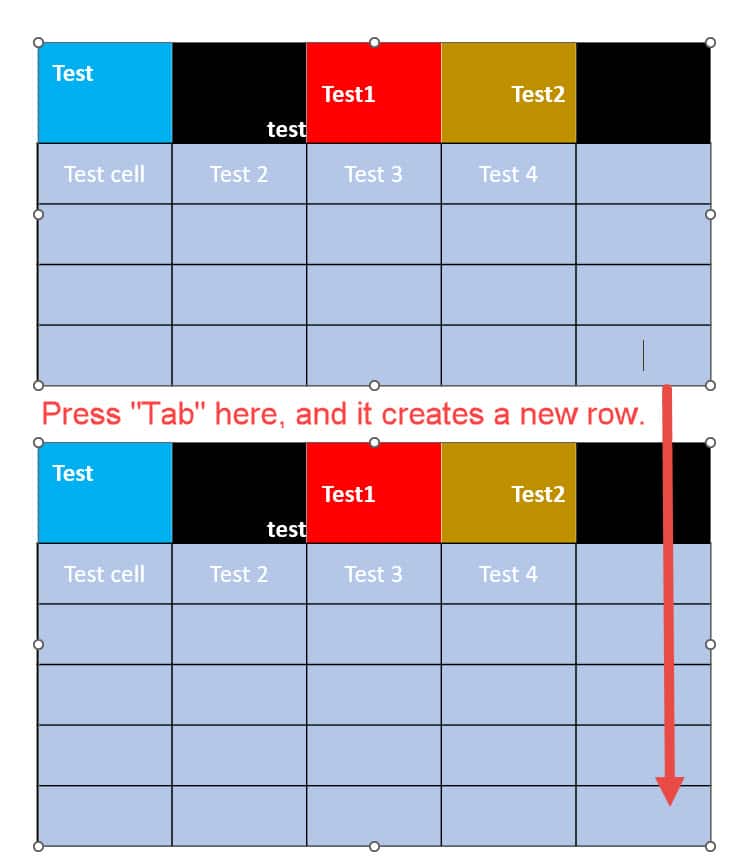
Tab is more useful because if you’re in the last cell of the table and you press it, PowerPoint will add another row to your table:
Practice Exercise for Tables in PowerPoint: The “Management Assumptions” Slide
In the practice exercise in this lesson, you have to insert a table with the correct number of rows and columns and then format it to match the “Management Assumptions” slide in the reference slides.
Do not worry about copying and pasting in the text, as that does not require any special knowledge of PowerPoint.
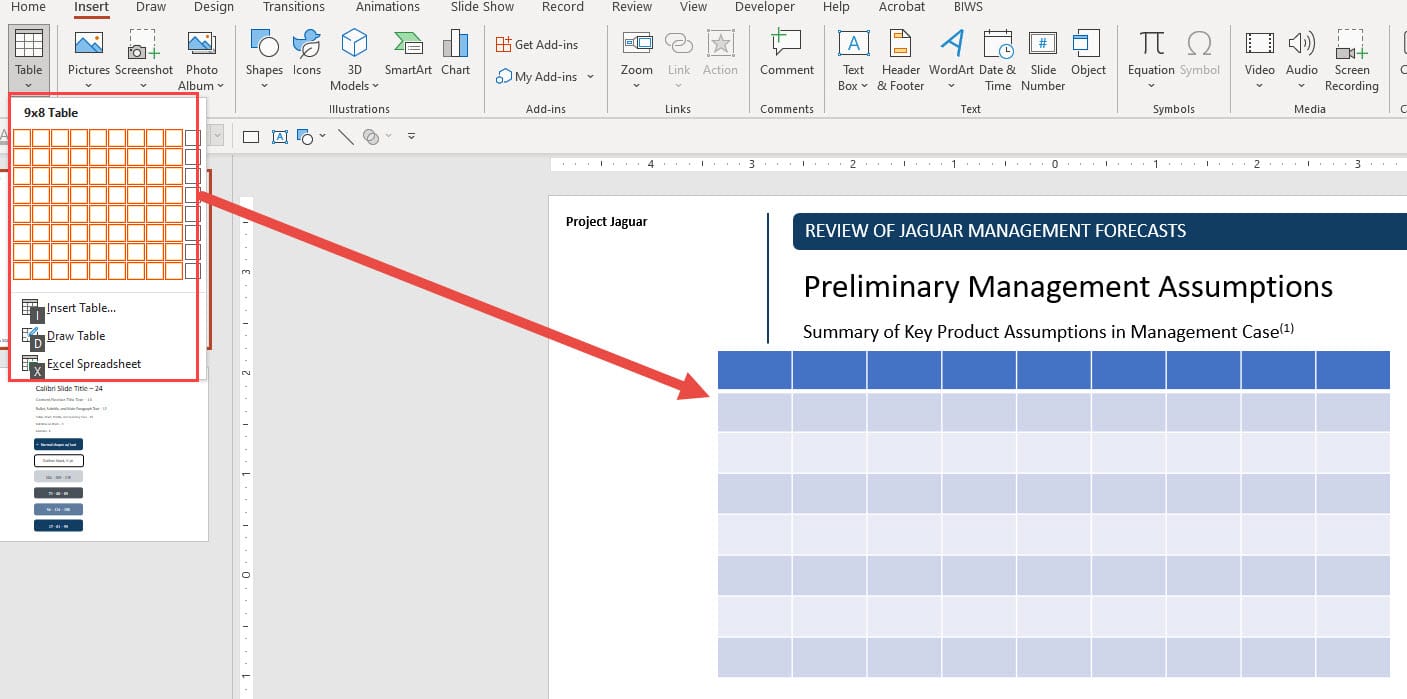
Step 1 is to insert a table with 9 columns and 8 rows:
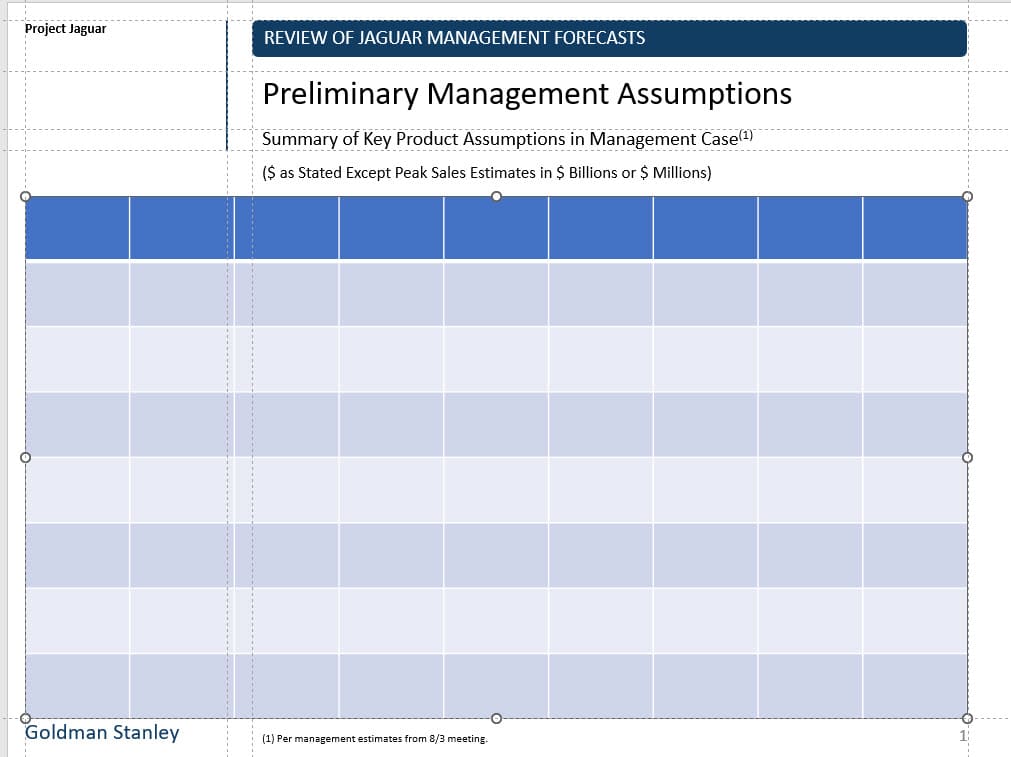
Step 2 is to enable drawing guides (Alt, W, S) and then resize the table so it fits the width and height of the slide:
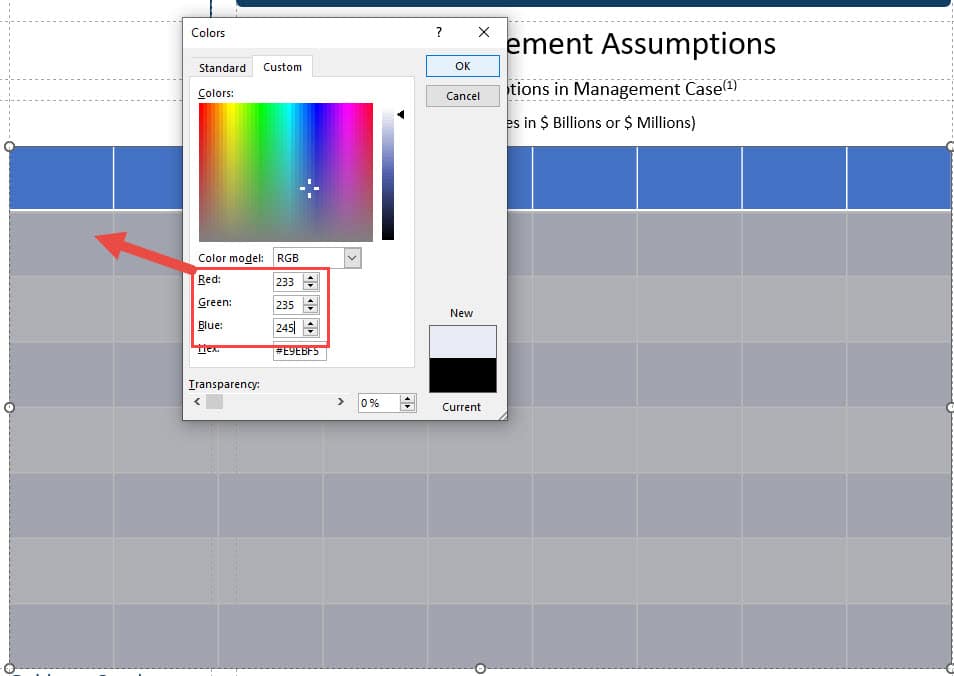
Step 3 is to fix the formatting, such as the fill colors, the font colors, the font sizes, and the borders:
We can access most of these shortcuts from the “Home” menu or the Quick Access Toolbar (QAT) that we recommend installing in the PowerPoint course.
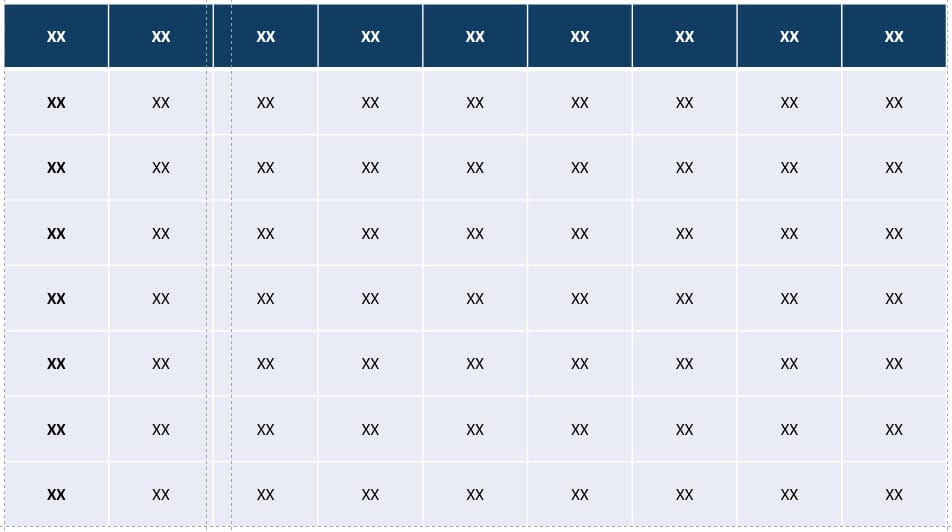
The table looks better after changing the colors and fonts everywhere, but we still need to fix the borders:
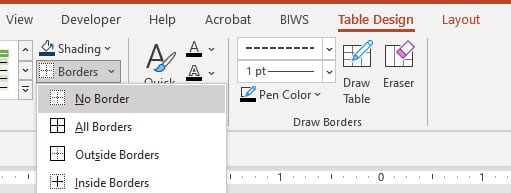
To do this, we can start by selecting the entire bottom area of the table, going to Table Design (Alt, JT), and selecting “No Borders”:
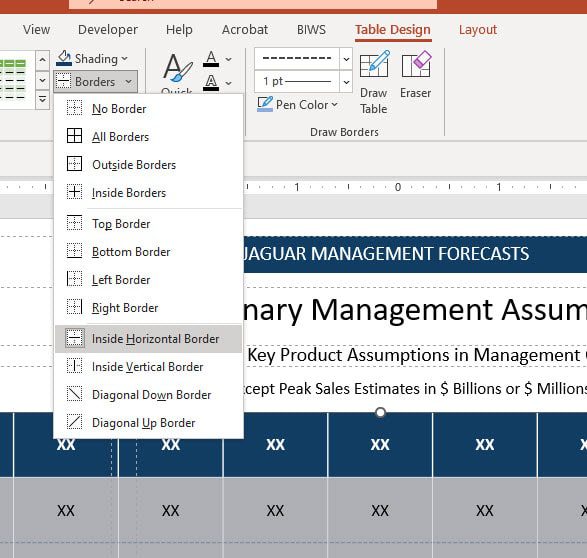
Then, we can keep these rows selected, return to “Table Design,” change the border formatting (color and style), and set the borders for just this region to “Inside Horizontal”:
This gets us close to the finished product in the “After” file.
The key points are that you can format individual cells, rows, and columns differently, but you cannot change the heights and widths of individual cells – only rows and columns.
And when you resize an entire table, the heights of all the rows and the widths of all the columns also change.
More Advanced Features of Tables in PowerPoint: Merging and Splitting Cells and Combining Shapes with Tables
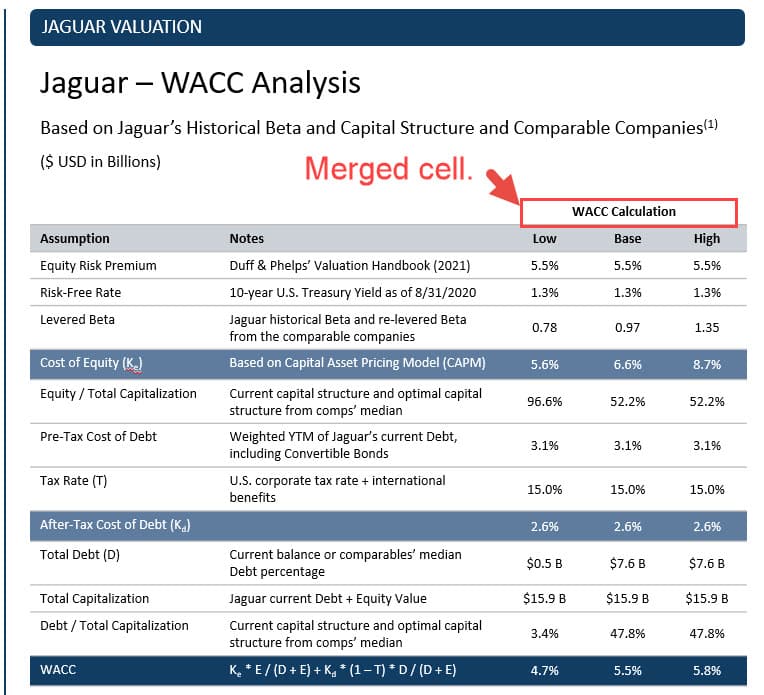
In our full PowerPoint Pro course, we cover additional features of tables, such as how to merge and split cells and combine them with images, Excel objects, and shapes to create diagrams.
Here are a few examples of slides we create using these features:
To learn about these features and get a crash course on tables in PowerPoint, including macros to automate your slides, check out our full PowerPoint Pro course.

About Brian DeChesare
Brian DeChesare is the Founder of Mergers & Inquisitions and Breaking Into Wall Street. In his spare time, he enjoys lifting weights, running, traveling, obsessively watching TV shows, and defeating Sauron.
